MQTT Server
How to set up your MQTT devices
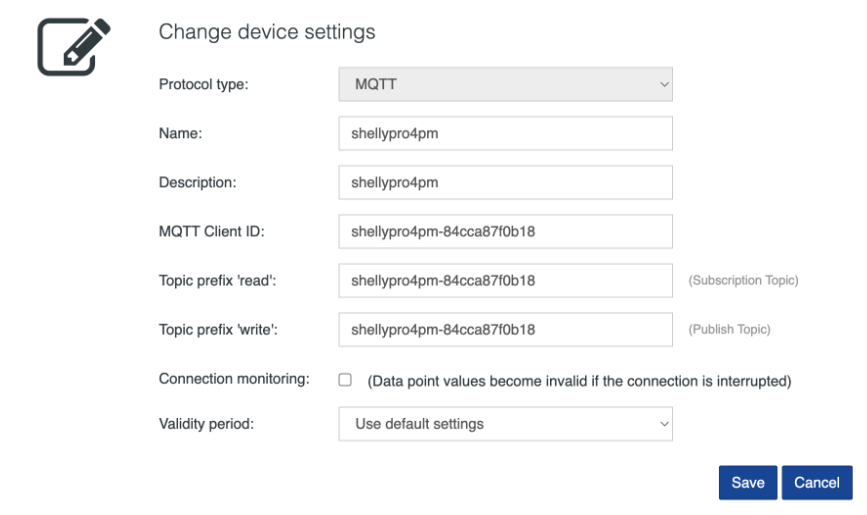
In order to integrate your devices into the HOOC ecosystem, the implementation of MQTT will be required. For this purpose, an MQTT broker is available on the standard port 1883/TCP. By clicking on the icon, a new MQTT device can be entered.
In case the device supports MQTT over TLS, it can also be integrated into the HOOC solution via a Secure Proxy Permalink, i.e. without a HOOC Gateway.

| Property | Description |
|---|---|
| Protocol type | Select MQTT Server (localhost) |
| Name | Enter the name of the device |
| Description | Enter the description of the device |
| MQTT Client ID | Specifiy the Client ID of the device |
| Topic prefix ‘READ’ | Choose this option in order to read data (optional) |
| Topic prefix ‘WRITE’ | Choose this option in order to write data (optional) |
| Connection monitoring | If this field is checked, all data points will not be marked as invalid in case of an interruption of the connection (last known value). For the connection monitoring to work, it is mandatory to specify the MQTT Client ID. |
| Validity period | Please note that if no value update is received during the predefined Intervall, the corresponding data point will be marked as invalid (Last known value). |
By clicking on the icon, status information of the MQTT Broker can be displayed.
Actions
The setup of a MQTT device allows a number of possible actions.

| Action | Description |
|---|---|
| Edit interface settings | |
| Export data points (if data points available) | |
| Import Datenpunkte (if no data points available) | |
| Remove interface (if no data points available) |
MQTT debug mode
The MQTT debug mode can be activated via . When the debug mode is on, data from the protocol can be analyzed. To do this, connect to the service IP address by using an MQTT client tool (e.g. MQTT Explorer).
Please note that after 30 minutes, the MQTT debug mode will automatically be deactivated.
Data points
The live values of the acquired data points are automatically displayed. By clicking on the icon, you can stop the data monitor.
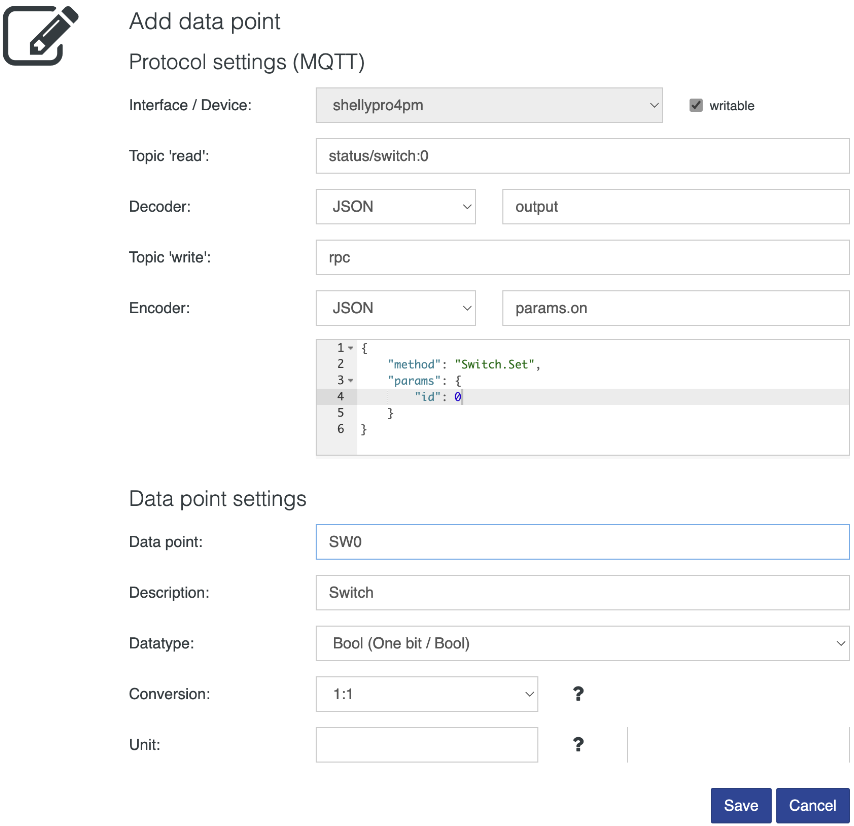
By clicking on the icon, a new data point will be created for the corresponding interface.

| Property | Description |
|---|---|
| Interface / Device | Select the device / interface |
| Topic ‘read’ (optional) | Optionally, enter the enlarged topic for data reading (the enlarged topic is the addition to the prefix already entered under Change settings / topic “read”) |
| Decoder | Select and enter settings for the data decoder |
| Topic ‘schreiben’ (optional) | Optionally, enter the enlarged topic for data writing (the enlarged topic is the addition to the prefix already entered under Change settings / topic “write”) |
| Encoder | Select and enter the settings for the data encoder |
| Data point | Enter the name of the data point |
| Description | Enter a description of the data point |
| Data type | Select a data type |
| Conversion | If required, values can be linearized, e.g. temperature in tenths to °C with one decimal place |
| Unit | Units in LaTeX format: e.g. ^\circ C for °C |
Custom encoder and custom decoder
In order to encode or decode data, select accordingly ‘encoder’ or ‘decoder’. The templates of the functions (Javascript) are displayed in the editor. More information about the parameters and return values can be found in the table below:
| Property | Decoder | Encoder | Description |
|---|---|---|---|
Parameter raw |
x | Byte array of raw data | |
Parameter value |
x | Data point value in the corresponding format (number, bool, string) | |
Parameter dataType |
x | x | Used data type of the data point (one of the following strings: “Int8”, “Int16”, “Int32”, “UInt8”, “UInt16”, “UInt32”, “Float32”, “Float64”, “Bool”, “String”) |
| Return value Decoder | x | Return value based on used data type (number, bool, string) | |
| Return value Encoder | x | Byte array |
In order to analyze data and implement custom encoders and custom decoders, it is recommended to activate the MQTT debug mode. (use near to Interfaces/Devices).
Actions
The setup of a data point allows a number of actions.

| Action | Description |
|---|---|
| Edit data point settings | |
| Edit Smart UI settings | |
| Show data point trend | |
| Write value of the data point (if writable) | |
| Duplicate data point | |
| Remove data point |
Device monitoring
If the MQTT Client ID parameter of the device is correctly configured, a data point for monitoring the connection can be created:
| Property | Value |
|---|---|
| Interface / Device | Select interface / device |
| Topic ‘read’ | Enter hfc/broker/clients/MQTT Client ID/connected |
| Decoder | Select decoder String |
| Data point | Enter name of the data point |
| Description | Enter the description of the data point |
| Data type | Select the data type Bool (One bit / Bool) |
| Conversion | Select conversion 1:1 |
The status will then be displayed as Boolean. This status can be used for further processing, e.g. in the HOOC Alert solution.
Restrictions
The MQTT functionality per site is restricted as follows:
| Description | Value |
|---|---|
| Maximum number of MQTT client connections | 10 |
| Maximum number of value updates per MQTT client connection (per IP address) | 720/h (then blocked for 24hours) |
| Support of classic MQTT broker functionality | no |