Monitoring
Functional description
Knowledge is power. This not only applies to the business world, but also to the operation of control systems in the industrial automation and building technology sector. To ensure that you have the necessary knowledge at your disposal at all times, HOOC therefore created a special monitoring service, integrating the IotT open source platform Grafana. Hence, you cannot only monitor the measured values of your technical infrastructure, but also compare, analyze and project business relevant data.
Installation of Grafana 6.0.2
In order to be able to visualize the values of your technical installations on your desktop, please follow the instruction described below on how to install Grafana on your windows operating system. Note that the field level data for the HOOC monitoring service will be provided by the HOOC Secure Remote Control service and be transmitted over API.
Instructions for the installation of Grafana:
- Open the Grafana Downloads URL
- Select the Windows platform
- Download the ZIP file windows-amd64.zip
- Unpack all files of the downloaded ZIP file into a folder of your choice
Configuration of the Grafana webserver port
After having successfully installed Grafana, you now want to configure its webserver port.
Instruction for the configuration of the Grafana webserver port:
- Change to the conf folder (subfolder of the unpacked files)
- Copy the file sample.ini in custom.ini
- Open the file custom.ini in your Notepad++ editor
- Search the line ;http_port = 3000
- Delete the character ; in front of the line ;http_port = 3000.
- Replace the value 3000 with 8080
- Save and close the custom.ini file
How to start Grafana
After Grafana has been installed and the web server port has been configured, you can then start the Grafana server.
Therefore:
- Change to the bin folder
- Execute the grafana-server.exe file
- Open the 127.0.0.1:8080 url
Now you land on the login page of Grafana. You can at first connect with the default login (admin/admin), but after that you might want to change your password.

Add data source
After having successfully logged in, you can add a data source.
- Go to configuration -> data sources
- Click on Add data source
- Click on InfluxDB
Then make the settings according to the information below:
| Property | Description (Value) | Example / Information |
|---|---|---|
| Name | Enter the name of the site | My site |
| HTTP URL | Enter the URL of the data source https://api.hooc.me/influx/v2/sites/SITE_ID |
Replace SITE_ID with the site ID |
| HTTP Access | Specify the access to the data source | Server (Default) |
| Auth | Select the authentication method | Select Basic Auth |
| Basic Auth Details | Enter the HOOC User and the password | Important: Users with OTP cannot be used |
| Database | Choose the system database you want to use | FieldCom_DataPoints |
The settings can be saved and tested by clicking Save and Test.
Data bases
| Data base | Description (Value) |
|---|---|
| FieldCom_DataPoints | Data point values transmitted over the HOOC Secure Remote Control service (SERC) |
| FieldCom_KNX | Values of the KNX group monitor transmitted over SERC |
| FieldCom_LoRa | Values of the LoRa monitor transmitted over SERC |
The credentials will be stored in the grafana.db file in the data folder. Please note that it is recommended to use a supporter without administrator rights.
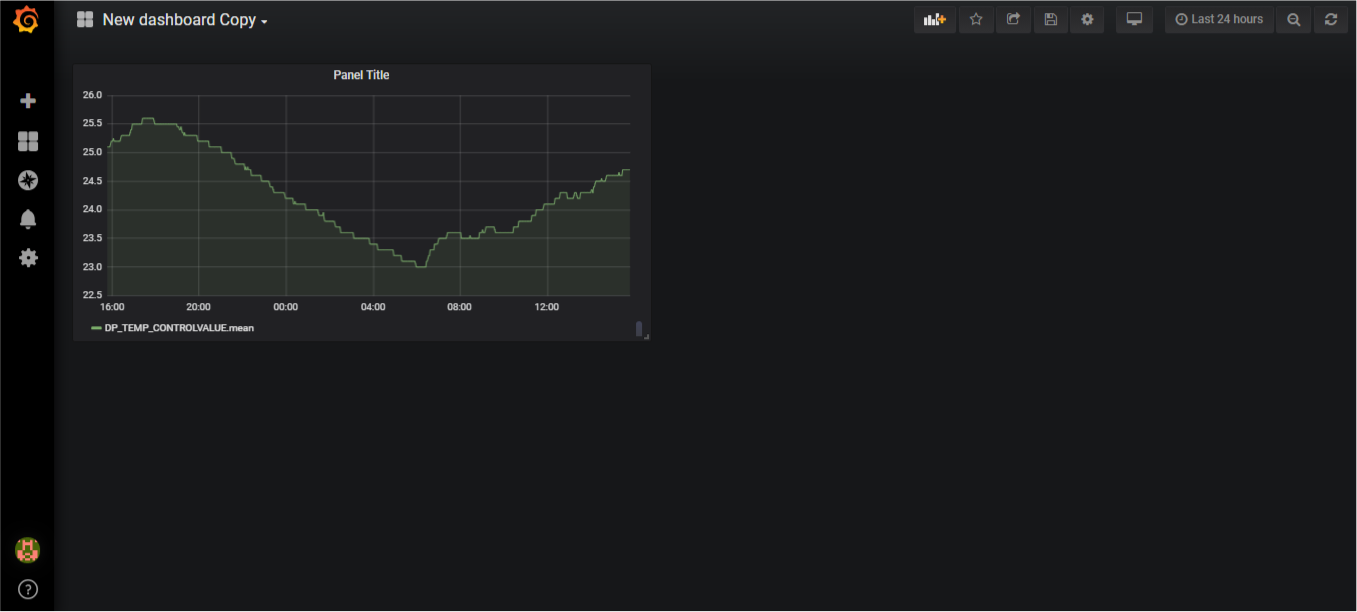
Create a dashboard / panel
After a data source is set up, a new dashboard or panel can be created.
- Go to {% font-awesome plus %}} Create -> {% font-awesome th-large %}} Dashboard
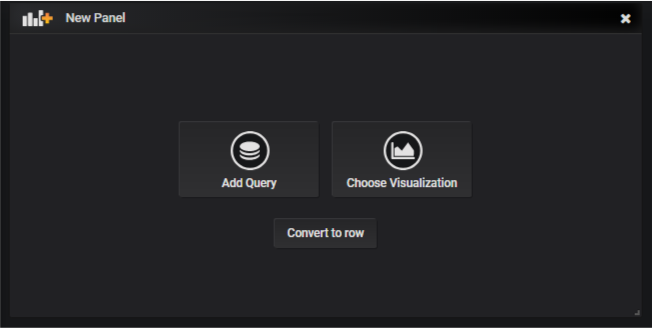
- Click on Add Query in order to add new data points to the panel
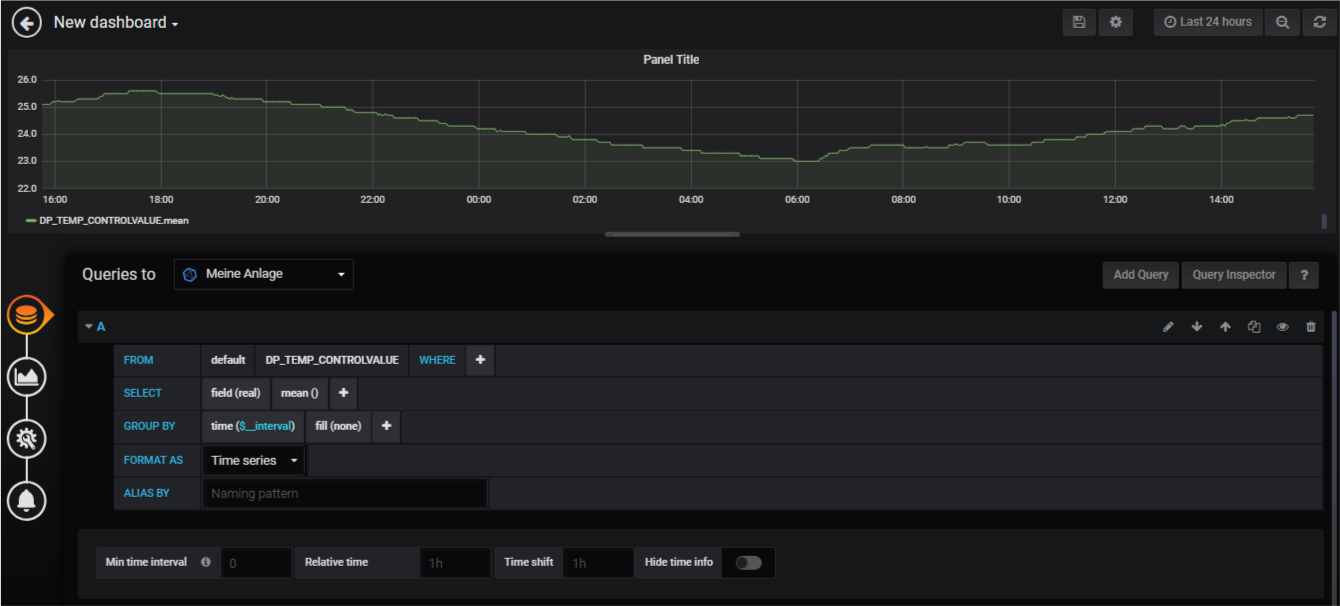
| Field with value | Description |
|---|---|
| My Site (system) | The name of the data source |
| DP_TEMP_CONTROLVALUE | The data point name as set up in the HOOC ManagementPortal |
| field(real) | The typed and converted data point value |
| fill(none) | In the graph, the points of the values are connected |
For further information, please check out the official Grafana documentation. After all settings have been made, they can be saved by clicking on the icon.